> For the complete documentation index, see [llms.txt](https://interfacing.gitbook.io/interfacing-help-files/llms.txt). Markdown versions of documentation pages are available by appending `.md` to page URLs; this page is available as [Markdown](https://interfacing.gitbook.io/interfacing-help-files/quality-managers/quality-event-application/tracking-and-monitoring-quality-events/quality-event-dashboard.md).

# Quality Event Dashboard

View trends, closure rates, and action performance with interactive charts and metrics.

Use the **Quality Event Dashboard** to track and analyze quality events. With it, you can:

* Monitor event closure trends
* Assess action item timeliness
* Identify high-risk periods or bottlenecks

{% hint style="info" %}
**Navigation:** Go to **Apps** > **QMS Dashboards** > **Quality Event Dashboard**.
{% endhint %}

***

## Using the Dashboard

Follow the steps below to explore, analyze, and act on data.

{% stepper %}
{% step %}

### Viewing Dashboard Metrics

The dashboard displays several charts, each offering a different perspective on quality event performance and activity.

<table data-card-size="large" data-view="cards"><thead><tr><th align="center"></th><th>What It Shows</th><th>Use It To</th></tr></thead><tbody><tr><td align="center"><strong>Total Quality Events Closed Per Month</strong></td><td>The number of quality events closed each month.</td><td>Identify closure trends, assess workflow efficiency, and anticipate resource needs.</td></tr><tr><td align="center"><strong>No. of Quality Event Action Items On Time vs. Past Due</strong></td><td>The number of action items completed on time compared to those that are past due.</td><td>Monitor compliance with deadlines and identify items requiring follow-up.</td></tr><tr><td align="center"><strong>Quality Event Count Per Month</strong></td><td>The total number of quality events reported each month.</td><td>Track overall event volume, spot trends, and adjust preventive measures.</td></tr></tbody></table>

***

{% endstep %}

{% step %}

### Filtering Metrics

Use filters to refine the data displayed in the dashboard:

* **Date – From / Date – To** — Restrict results to quality events that fall within the selected date range.

After selecting your criteria, click **Apply** to refresh the charts.

***

{% endstep %}

{% step %}

### Interacting with Charts

Interact with charts to explore details and uncover specific data:

* **Hover** over data points (e.g., bars or pie slices) to view tooltips showing the category and item count.
* **Double-click** a data point to drill down from a summary view into a detailed list.
  * **Example:** Double-click the **Deadline Passed** slice in the **Action Items** chart to view all related items in a form.

***

{% endstep %}

{% step %}

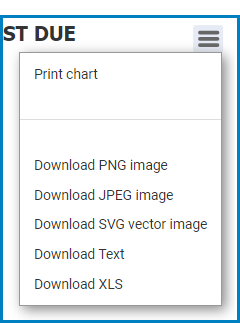
### Exporting or Downloading Charts

Export charts for reporting or offline use.

* Select the **hamburger menu** ( <i class="fa-bars">:bars:</i> ) in the top-right corner of the chart.
* Choose an export format:
  * PNG image
  * JPEG image
  * SVG vector image
  * Text file
  * XLS file

<figure><img src="https://manula.r.sizr.io/large/user/10696/img/audit-dashboard-3_v2.png" alt="" width="188"><figcaption></figcaption></figure>

***

{% endstep %}
{% endstepper %}

***


---

# Agent Instructions
This documentation is published with GitBook. GitBook is the documentation platform designed so that both humans and AI agents can read, navigate, and reason over technical content effectively. Learn more at gitbook.com.

## Querying This Documentation
If you need additional information that is not directly available in this page, you can query the documentation dynamically by asking a question.

Perform an HTTP GET request on the current page URL with the `ask` query parameter, and the optional `goal` query parameter:

```
GET https://interfacing.gitbook.io/interfacing-help-files/quality-managers/quality-event-application/tracking-and-monitoring-quality-events/quality-event-dashboard.md?ask=<question>&goal=<endgoal>
```

`ask` is the immediate question: it should be specific, self-contained, and written in natural language.
`goal` is optional and describes the broader end goal you are ultimately trying to accomplish on behalf of the user. GitBook uses it to tailor the answer towards what is most useful for that goal.

The response will contain a direct answer to the question and relevant excerpts and sources from the documentation.

Use this mechanism when the answer is not explicitly present in the current page, you need clarification or additional context, or you want to retrieve related documentation sections.